Repository entries that are recognized as grids (i.e, can be read by the
netCDF-Java Common Data Model (CDM) grid reader (e.g. netCDF, GRIB, GrADS))
provide an option for extracting time series of data can be used to create
a graph, or downloaded or stored in the repository. From the
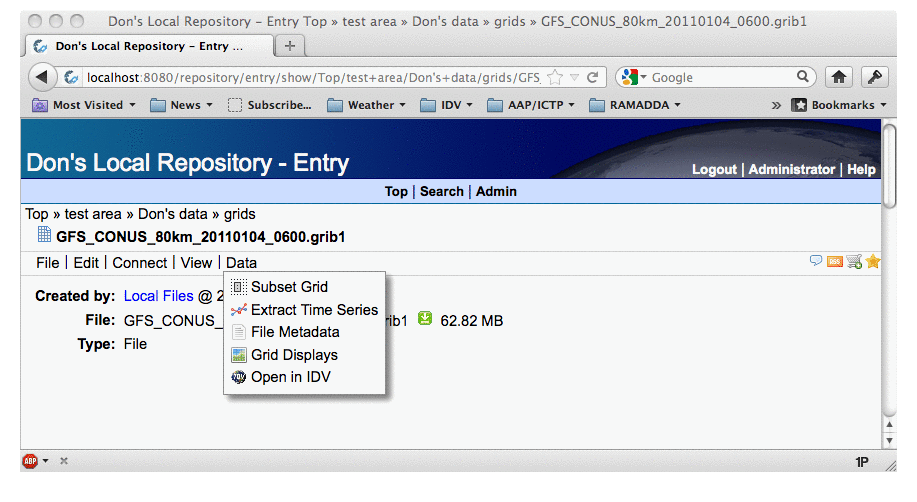
menu, select the
menu:
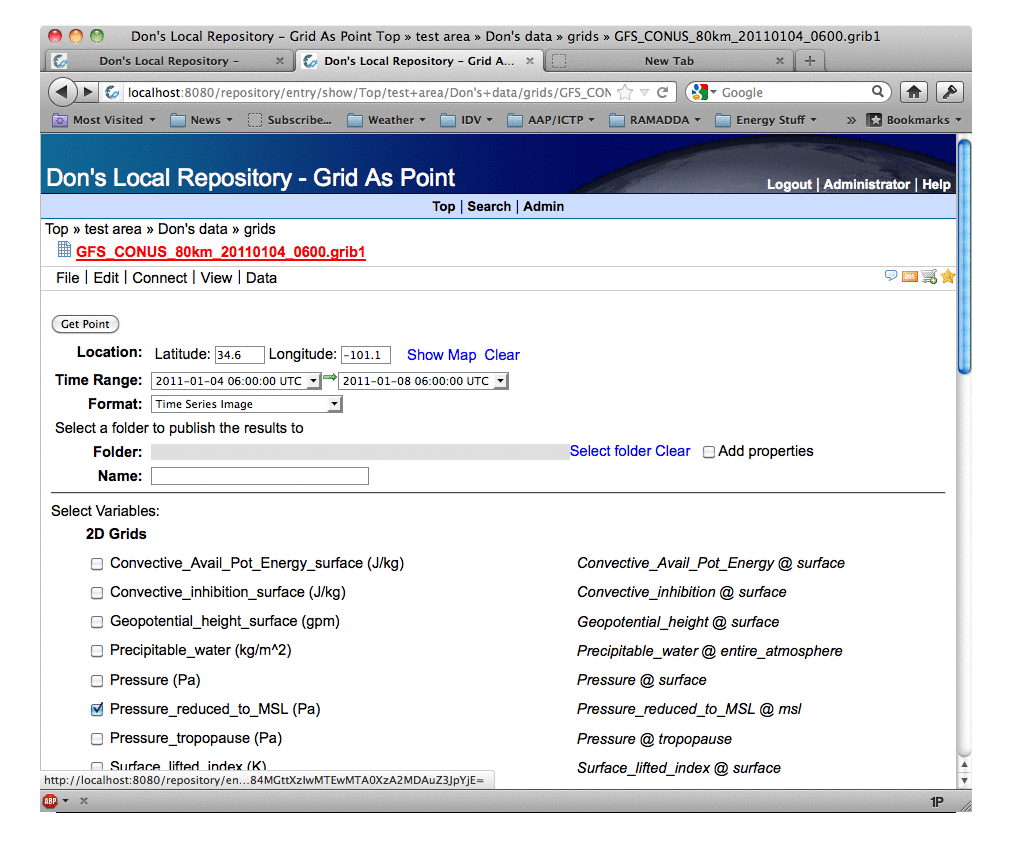
The Grid As Point form allows you to subset the grid at a point,
for a time range and list of variables.
Options:
- Location
Enter the latitude and longitude of the point. Click on the link to pop up a map where you can select the point. The link removes the selection.
- Time Range
Set the time range for the subset. Default is all times.
- Format
Set the output format. The choices are:
- NetCDF - Store in a netCDF file
- Xml - Create an XML with the values
- Time Series Image - Generate a time series image
- Comma Separated Values (CSV) - Create a CSV file with the values.
- Select a folder to publish the results to
If you are logged in and have permission to add files to the repository, you can optionally add the file to the repository. Specify the Folder location and a name for the file.
- Select Variables
Select the variables that you wish to include
in the output. For 3D grids, you can specify a level in the units of
the original data. NOTE:Mixing 2D and 3D variables in the output may
cause problems.
Using Grid As Point as a Web Service:
You can script the time series extraction using a web service by providing the appropriate URL arguments.
This service is specifie with the
output=grid.gridaspoint URL argument.
Specify the entry:
The entry that you want to extract data from can be specified by including the entry id in the URL arguments, or by specifying the URL using path to the entry in the RAMADDA hierarchy. Using the entry id is preferred because it will not change if the entry is moved to another area of the RAMADDA hierarchy.
By Entry:
http://myramadda.edu/repository/entry/show?output=grid.gridaspoint&entryid=e5ba6c2c-5305-47f0-a92f-353774303d0a
By Path:
http://myramadda.edu/repository/entry/show/Top/Test Area/myfile.nc?output=grid.gridaspoint
Specify the location:
The geographic location is specified by:
- location.latitude
- location.longitude
Examples:
- &location.latitude=40&location.longitude=-105
- &location.latitude=32.67&location.longitude=240.6
Location longitudes can be specified in either -180/180 or 0/360 decimal degrees.
Specify the output:
There are several formats that the data can be returned in:
- &format=csv - Comma-Separated-Values (CSV)
- &format=image - a pregenerated time series plot
- &format=xml - XML format
- &format=netcdf - a netCDF file
Specify the variable:
Variables are specified by the variable name and multiple variables can be requested at the same time.
- &variable.air=true
- &variable.Pressure_reduced_to_MSL_msl=true&variable.Surface_lifted_index_surface=true
Specify the level:
If the variable has multiple levels, you can select a particular level:
Note: The level value must be in the units of the levels in the file. For some grids (e.g. GRIB1
format), the pressure values will be in hectoPascals (hPa). In others (e.g. GRIB2), the values are in
Pascals.
Specify the time range:
You can specify a start/stop time for the time series values. The default if not specified is the
entire time range of the data. Times can be specified as a date or a date time using the WC3 style (yyyy-mm-ddThh:mm:ss).
- &fromdate=2001-01-07&todate=2001-01-19
- &fromdate=2012-10-30T00&todate=2012-11-10T18:00
Putting it all together:
Here are some sample URLs:
- Extract a July temperature time series from the 2011 NCEP Reanalysis data to a CSV file:
http://www.esrl.noaa.gov/psd/repository/entry/show/PSD Climate Data Repository/Public/PSD Datasets/NCEP Reanalysis (R1)/4xDaily Grids/Surface/Air Temperature at sigma level 995/air.sig995.2011.nc?output=data.gridaspoint&location.latitude=40.5&location.longitude=-105&format=csv&variable.air=true&fromdate=2011-07-01&todate=2011-07-31T18
- Generate a time series plot of 850 hPa temperatures and heights from a GRIB2 file for all times:
http://ramadda.org/repository/entry/show?output=data.gridaspoint&entryid=7ba92e2a-b6c8-43e4-8359-4043ca3e72e0&location.latitude=-1.148&location.longitude=22.852&calendar=gregorian&format=timeseries&level=85000&variable.Temperature_isobaric=true&variable.Geopotential_height_isobaric=true