Shows tabular data. This is integrated with other charts so clicking on a row highlights the corresponding record in a chart.
{{display type="table" height="400"}}
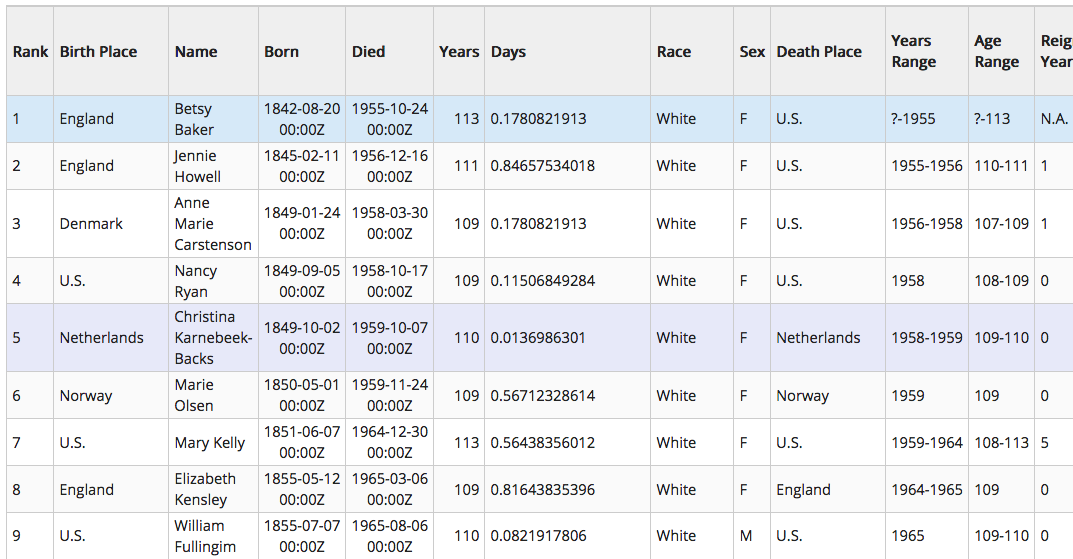 Image 1: Table
Displays the records, one row per record, with each cell color coded based on the field value and the specified color table.
{{display type="heatmap" type="heatmap"  height="400"  fields=""
colorTables="temperature,blues"
colorByMins="-90,0"  colorByMaxes="45,100"
showIndex="false"  showValue="true"
showBorder="true"
cellHeight="30"
textColor="white"}}
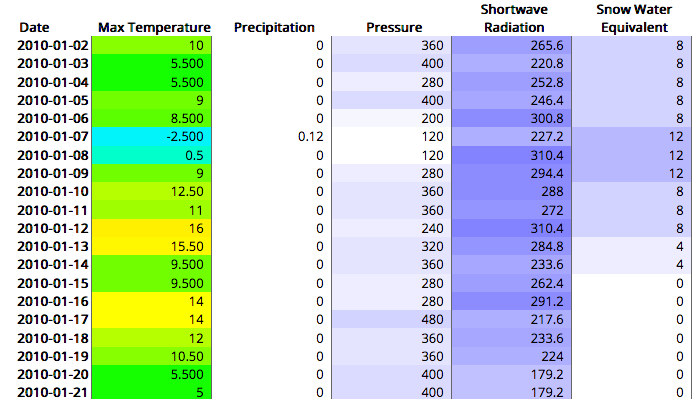 Image 2: Heatmap
Displays a statistical correlation of a set of fields.
{{display type="correlation" fields=""}}
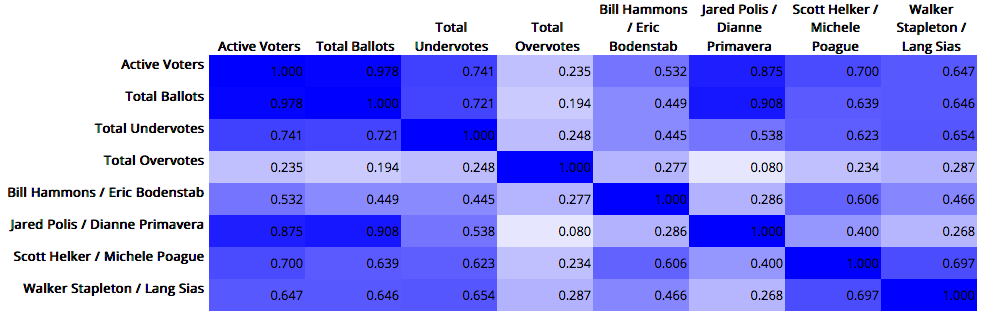 Image 3: Correlation
Displays the record selected in other charts.
{{display type="text"}}
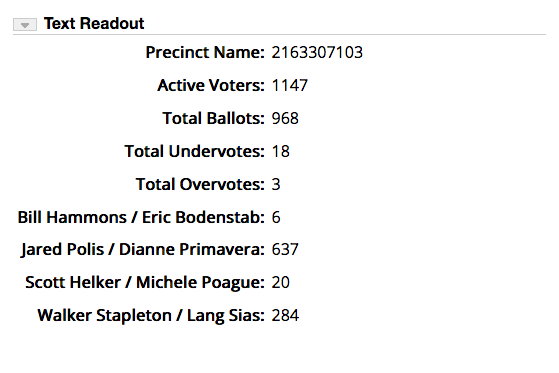 Image 4: Text Readout
Displays a summary statistics including average, min, max, number of missing, etc. There are a number of values that are shown. To turn all of them off and only set a few set the [ug::attr showDefault] to false.
{{display type="stats" loadData="false"
showDefault="true"
#showMin="true"
#showMax="true"
#showAverage="true"
#showStd="true"
#showPercentile="true"
#showCount="true"
#showTotal="true"
#showMissing="true"
#showUnique="true"
#showText="true"}}
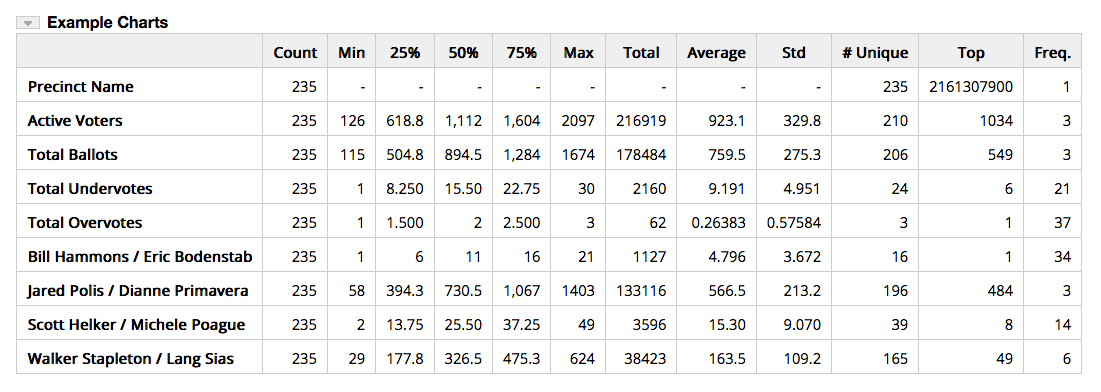 Image 5: Summary Stats
The template display displays text based on a template populated by data. There can be a headerTemplate and footerTemplate specified that are used once. The template= attribute is used to
show text for each record in the data. Not all template attributes need to be specified.
{{display type="template" template="..."   //Used for each record
headerTemplate="... ${totalCount} ... ${selectedCount}"  //used at the beginning
footerTemplate="... ${totalCount} ... ${selectedCount}"  //used at the end
selectField="field name to get the value to select on"  //specify a field to select on
select="max|min|<|>|=|>=|>=|contains"   //specify an operator
selectValue="some value"   //and a value
emptyMessage=""   //Message to show if nothing meets the selection criteria}}
The Dot plot requires a string value field and a numeric field.
It uses the string values as the Y-axis and shows the value
field along the X-axis.
{{display type="dotplot" fields="race,years_decimal"
xAxisTitle="Age"
marginLeft="200"
width="100%" height="300"}}
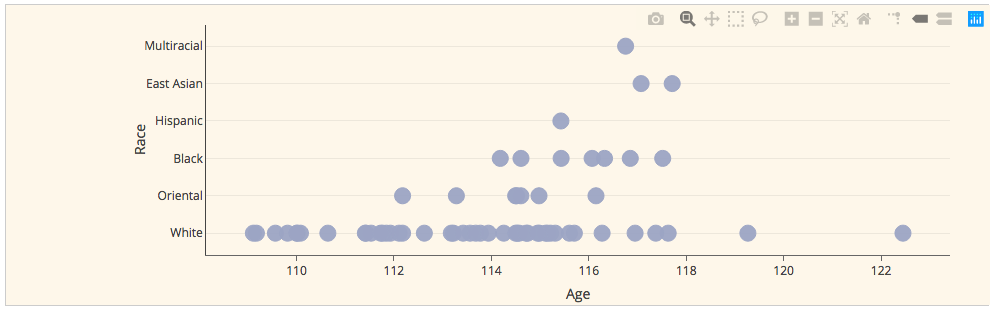 Image 6: Dot Plot
Displays flow data. The point data needs to have 2 string fields (the from and to) and a numeric value field.
If [ug::attr doCategories] is set to true then the display requires 2 string fields and a count of the
unique pair values of the strings are used for the values.
{{display type="sankey" doCategories="true|false"
height="400"
#fields=""}}
Example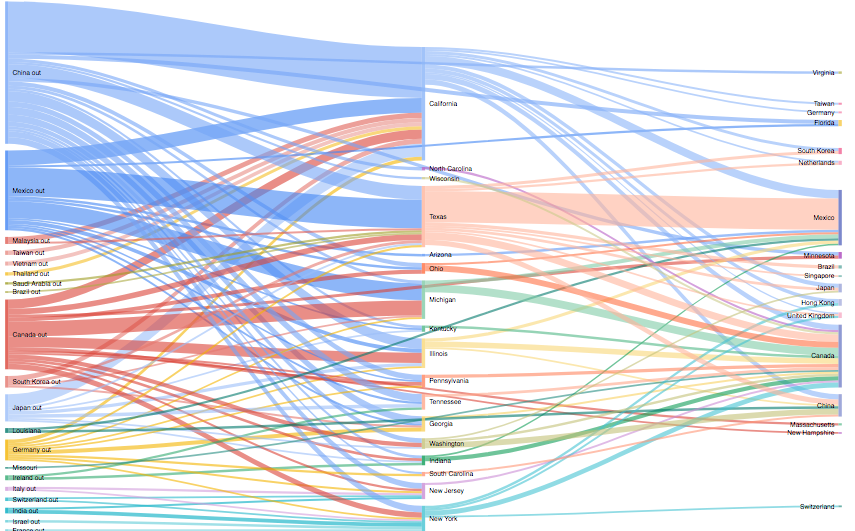 Image 7: Sankey
Shows a word or tag cloud of the text fields of point data. When the user clicks on a word
the data that matches the word value is shown in a table. The
tableFields attribute define what
fields to show in the table. If combined=true then all of the selected fields
are shown in one word cloud.
{{display type="wordcloud" fields="sex,race"
tableFields="rank,name,years,birth_place,sex,race"
combined="true|false"}}
Example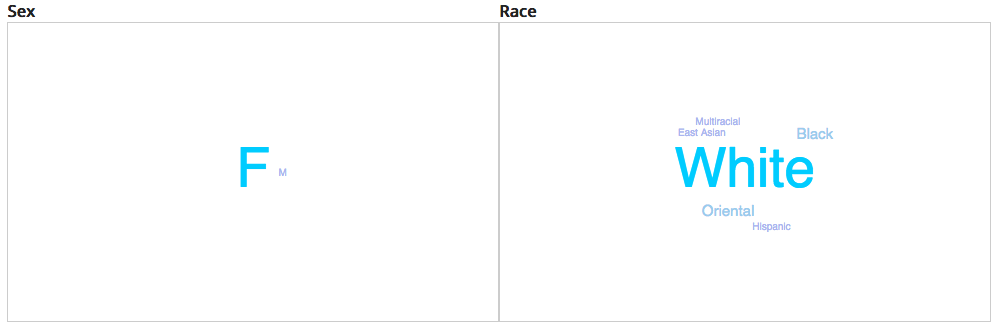 Image 8: Word Cloud
This creates a tree of the selected fields. Each row in the data is essentially converted to a "sentence", the
words of which are then displayed in tree form. If a field is numeric then the data is subvidided
by the numbero of buckets (the default is 10) and the "word" is the bucket range.
This can be overridden with the [ug::attr numBuckets] attribute. For a specific field append the
field ID to the attribute.
The bucket ranges can be specified with the [ug::attr buckets] attribute. The text label
to use can be specified with the [ug::attr bucketLabels] attribute.
The [ug::attr treeRoot] attribute is the text used to start the tree.
{{display type="wordtree" treeRoot="People"
fields="years,sex,race,name"

numBuckets="number of buckets to use for all numeric fields"
numBuckets.<field id>="number of buckets to use for a specific field"

buckets="100,110,115,120,130"
bucketLabels="Young,Middle,Old,Really old"
Or:
buckets.<field id>="100,110,115,120,130"
bucketLabels.<field id>="Young,Middle,Old,Really old"

height="800px"
chartWidth="900"}}
Example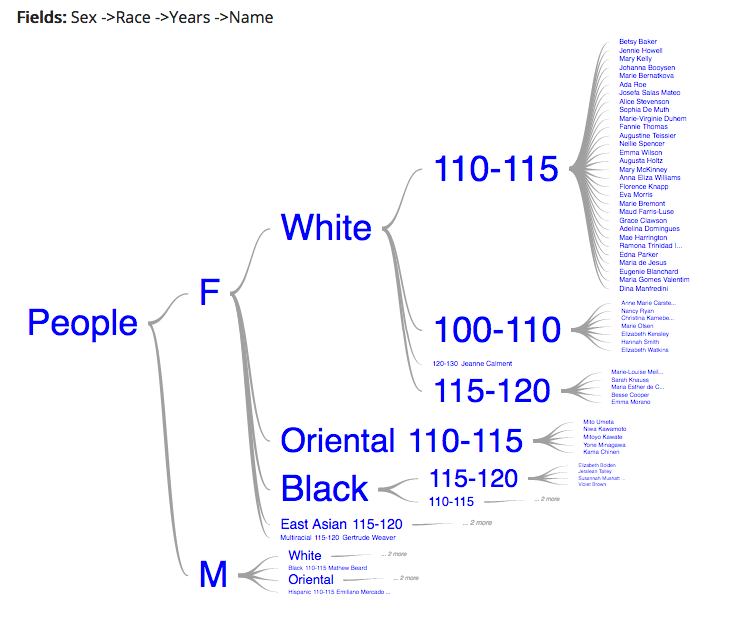 Image 9: Word Tree
Data that has 2 date fields can be shown in a timeline.
If [ug::attr showLabel] is true then text is shown inline in the timeline bars. The fields
that are shown are specified with the [ug::attr labelFields] attribute. The [ug::attr labelFieldsTemplate]
attribute defines how the label is shown.
{{display type="timelinechart" fields="rank,born,died"
width="100%"  height="800"
showLabel="true"
labelFieldsTemplate="{name}  Age: {years}  Birth Place: {birth_place}  Race: {race}"
labelFields="name,race,birth_place,years"}}
Example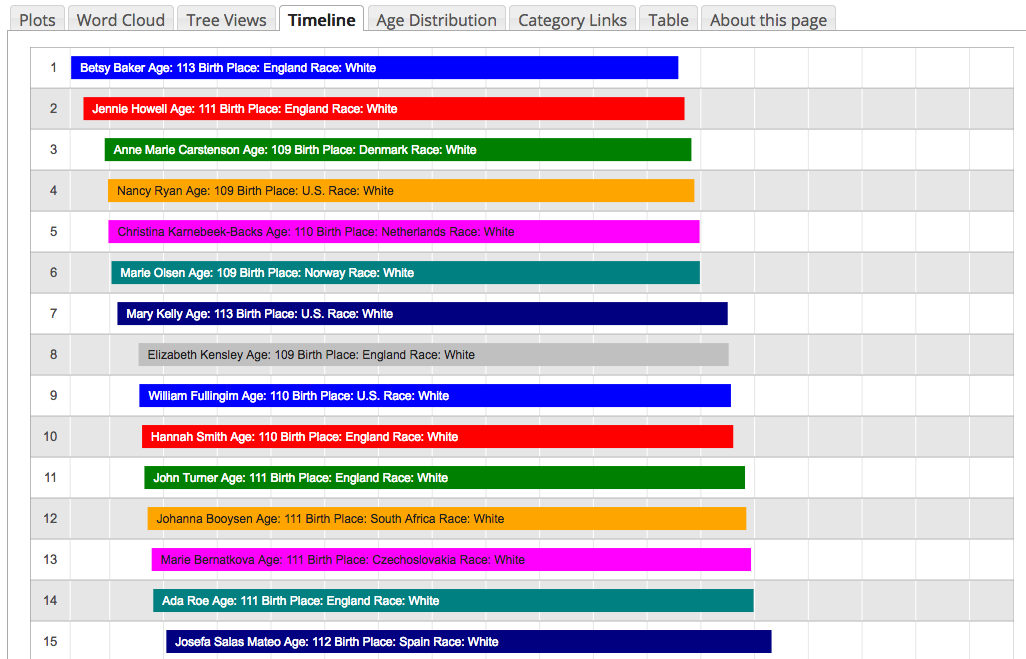 Image 10: Timeline